Quick Answer: "AI agents for data pipeline automation" covers two different things people mean by the phrase. The first is agents that write and repair pipeline code — schema mapping, transformation logic, orchestration. The second is agents that watch what a pipeline produces and take governed action on it: flagging anomalies, reconciling exceptions, triggering downstream workflows, with an audit trail behind every action. Most vendors only do the first. This guide covers 35 real use cases across both, plus a framework for choosing between them.
Type "AI agents data pipeline automation" into Google and you'll get a wall of near-identical listicles: the same dozen tools, the same "self-healing pipeline" pitch, the same generic efficiency stats with no deployment behind them. That's useful if you already know exactly what you're buying. It's not useful if you're trying to figure out what "automation" actually means here, because the phrase is doing two jobs at once — and almost nobody separates them.
This guide does. It's built from real, anonymized enterprise deployments — not vendor marketing copy — and organized around a distinction that matters more than any feature checklist: agents that build your pipeline versus agents that act on what your pipeline produces.
What "AI agents for data pipeline automation" actually means
When people search this phrase, they usually mean one of two things, and conflating them is where most buying decisions go wrong.
Flavor one: agents that build and repair pipelines. This is the world of AI-assisted ETL/ELT — agents that generate transformation code, map schemas between systems, write SQL, and patch a broken job when an upstream source changes shape. Think of this as AI applied inside the pipeline tooling you already run — dbt, Airflow, a lakehouse notebook. It's genuinely useful, and it's a legitimate, fast-growing category.
Flavor two: agents that act on what a pipeline produces. This is a different problem. Your pipelines are already running. Data is already landing where it should. The question is what happens next: who notices the anomaly, who decides whether it matters, who's authorized to act on it, and who's accountable if the action was wrong. This is monitoring, reconciliation, decisioning, and governed execution — the operational layer that sits above the pipeline, not inside it.
Most of the content ranking for this keyword only covers flavor one. That's a real gap, because in practice, most enterprises need both — and they usually buy them from different places. A team standardized on a lakehouse will reach for flavor-one tooling to build pipelines faster. But once those pipelines are running reliably, the harder and more expensive problem is flavor two: turning a stream of events, exceptions, and anomalies into governed business action without either drowning a team in alerts or handing an AI agent unsupervised write access to a production system.
This guide is built around flavor two — with the use cases, evaluation framework, and platform comparison to match. If you're specifically hunting for code-generation and transformation-authoring tools, the category comparison in Section 4 below will point you to where that fits and where it doesn't overlap with what follows.
Why this is the harder problem to buy for
The market has largely solved "detect that something happened." Anomaly detection, schema-drift alerts, and pipeline-health dashboards are table stakes now — nearly every tool on the market claims some version of "self-healing." What's much less solved is what happens between detection and action: who's allowed to approve a fix, what gets logged, and how a regulated business defends that decision six months later if someone asks why an automated system moved money, changed a price, or waived a fee.
That's not a data-engineering problem. It's a governance problem wearing a data-engineering costume — and it's the reason a straightforward "best AI agents for pipelines" listicle usually undersells what's actually at stake in the buying decision.
The Data Pipeline Automation Maturity Ladder
Before comparing platforms, it helps to know what level of automation you're actually asking for — and what level a vendor is actually offering, since "AI-powered" gets stretched to cover everything from a chatbot that reads a dashboard to a system that autonomously modifies production data.
| Level | What happens | Human role |
|---|---|---|
| 0 — Manual | Engineers watch dashboards and diagnose failures by hand | Does everything |
| 1 — Assisted | An agent surfaces an anomaly or drafts a proposed fix; a human applies it | Reviews and applies every action |
| 2 — Co-piloted | An agent proposes and stages a remediation; a human approves before it runs | Approves before execution |
| 3 — Bounded autonomy | An agent executes within a clearly defined scope — re-running a failed job, sending a standard alert, applying a pre-approved fix — and escalates anything outside that scope | Manages exceptions only |
| 4 — Governed, exception-managed | An agent owns the normal operating path end-to-end; a human only ever sees what's been flagged as an exception, with a full audit trail behind every action taken | Sets policy, reviews exceptions, retains accountability |
Use this table as a diagnostic when you're evaluating vendors. Ask directly: "Which level are we actually buying, for which decision types?" Most vendors default to Level 1 or 2 no matter what the marketing says — and for plenty of workflows, that's the right level to buy. The mistake is not knowing which level you're getting until something breaks in production.
Why assistents.ai for this second problem
Most of what's marketed as "AI agent data pipeline automation" stops at flavor one — writing and patching pipeline code. That's useful, but it leaves the harder question unanswered: once the pipeline runs clean, who decides what to do with what it found, and who's accountable for that decision?
assistents.ai is built for that second problem. It connects directly to your operational databases and picks up change-data-capture and event streams so context stays current between queries — then applies your business rules, routes the result through an approval policy matched to how much authority you're willing to hand over, and executes with a full trace of what happened and why. It doesn't try to replace your ETL tooling. It's the governed layer that turns what your pipeline produces into something a compliance team will actually sign off on.
How to evaluate an AI agent platform for data pipeline automation
Five questions worth asking before you sign anything — the ones most feature-comparison pages skip, and the ones that separate a platform you can trust with production data from one you'll be firefighting in six months.
1. Transparency. Can you see exactly what data an agent touched, which source it came from, and why it flagged what it flagged — or is the reasoning a black box you have to trust blindly? A platform that can't show its work isn't one you can defend to an auditor.
2. Governed autonomy, not just automation. Does the platform let you set different autonomy levels for different decision types — full autonomy for a low-stakes routine alert, mandatory human approval for anything that touches money or a regulated system — or is it all-or-nothing? All-or-nothing autonomy is where most pilots stall, because no risk team will sign off on it.
3. Audit trail. Is every action logged with a reproducible trace — what triggered it, what rule or policy authorized it, what happened as a result — or only the successful runs? If a decision from three months ago gets questioned, can you reproduce exactly what the system saw and did at the time?
4. Model and deployment neutrality. Are you locked into one model provider's roadmap, one hosting environment, one region? Enterprises with data-residency or model-choice requirements need this answered before, not after, a deployment is underway.
5. Where it sits relative to your existing stack. Does the platform try to replace your pipeline tooling — expensive, risky, and a multi-year commitment — or does it sit above what you already run and act on what comes out of it? The second path is almost always faster to prove out and lower-risk to reverse if it doesn't work.
35 real AI agent use cases for data pipeline automation
These are grouped by function, then by industry. Each use case is tagged with a rough autonomy level from the ladder above — most production deployments live in the Level 2–3 range, not the fully autonomous Level 4 the marketing usually implies.
A. Ingestion, connectivity & event intake
1. Multi-dialect database querying without custom connector code (L1–2) Direct, dialect-aware connectivity across PostgreSQL, Microsoft SQL Server, ClickHouse, DuckDB/MotherDuck, Amazon Athena, and Google BigQuery means an agent can query operational systems in their native SQL dialect instead of routing every request through a brittle custom integration layer someone has to maintain.
2. Change-data-capture and event-stream intake (L2–3) Rather than polling a source every few minutes and hoping nothing changed in between, agents pick up CDC feeds and event streams so operational state stays current continuously — critical for any workflow where a stale read leads to a wrong decision.
3. Document ingestion into a governed, citation-backed knowledge layer (L1–2) Contracts, invoices, policy documents, and correspondence get ingested with semantic search and configurable relevance thresholds, and every answer an agent gives from that content comes back with a citation to its source — so a human can trace an answer back to the exact document it came from.
4. Scheduled and event-triggered pipeline kickoff (L2) Cron-based scheduling with timezone support, plus authenticated webhook triggers, replace manual batch-run babysitting — a pipeline starts because a defined condition was met, not because someone remembered to click "run."
5. Mailbox and inbox polling that turns messages into structured work (L2–3) IMAP and Outlook polling turns an inbound email — a purchase order, a compliance query, a customer complaint — into a structured, trackable work item automatically, instead of sitting in an inbox until someone reads it.
B. Schema, metadata & data quality
6. Schema-drift flagging (L1–2) When an upstream source adds a column, renames a field, or changes a data type without warning, an agent compares incoming structure against a known baseline and flags the deviation before it silently breaks a downstream report.
7. Data-quality exception triage (L2) Incomplete records, duplicates, and out-of-bound values get flagged and routed for review automatically, instead of surfacing three weeks later as a wrong number in a board deck.
8. Cross-system reconciliation (L2–3) When two systems should agree on the same fact — a payment amount, an inventory count, a customer balance — and don't, an agent flags the mismatch with enough context (both source values, both timestamps, both provenance chains) for a human to resolve it in minutes instead of hunting through two systems by hand.
9. Metadata and lineage surfacing (L1) An agent can trace a number back through the chain of transformations and sources that produced it, so "where did this figure come from" has a real answer instead of a shrug.
10. Documentation generation (L1) Pipeline logic, data definitions, and transformation rules get documented as they're built, closing the gap where the only record of "why does this field exist" lives in one engineer's memory.
11. Semantic-layer enforcement (L2) A configured semantic layer means "overdue," "active customer," or "at risk" carries one definition everywhere it's queried — by a dashboard, by an agent, by a different team entirely — eliminating the recurring problem of two teams arriving at two different numbers for what should be the same metric.
C. Anomaly detection, monitoring & alerting
12. Threshold and policy-breach detection (L2–3) Key operational metrics get monitored continuously against defined thresholds, with breaches routed as alerts rather than discovered on next week's dashboard review.
13. Statistical anomaly detection (L2–3) Volume drops, distribution shifts, and unusual patterns get flagged against a learned baseline — catching problems that a fixed threshold rule would miss entirely because nothing crossed a hard-coded line, it just stopped looking normal.
14. Continuous multi-source competitive and market monitoring (L2–3) Pricing, availability, ratings, and promotional data get pulled continuously across many external channels and consolidated into one layer that a leadership team can query directly, in plain language, instead of manually checking a dozen sites every morning.
15. Energy and utility consumption monitoring (L2–3) Consumption data from utilities, building-management systems, and IoT sensors feeds forecasting models that predict usage patterns and flag inefficiencies before they show up as an unexplained spike on a bill.
16. Smart-grid and infrastructure sensor monitoring (L2–3) Sensor and operational data from grid and connected-asset infrastructure feeds predictive models for outages, losses, and field issues, with automated alert routing to the right team instead of a general ops queue.
17. SLA and commitment-breach detection (L3) When a service-level agreement or an internal commitment is about to be missed, an agent detects it early enough to escalate — rather than after the breach has already happened and the only option left is damage control.
D. Reconciliation & exception handling
18. Invoice-to-payment reconciliation (L2–3) Payments get matched against invoices automatically, with mismatches — short payments, duplicate payments, wrong references — flagged for a human rather than buried in a spreadsheet reconciliation nobody has time to run weekly.
19. Dispute and fraud-signal triage (L2–3) High-volume transaction data gets screened for dispute and fraud signals, with evidence collected and a severity classification attached before the case ever reaches a human — cutting the time between "something looks wrong" and "someone is looking at it."
20. Duplicate and stale-record detection (L2) CRM and ERP records get scanned for duplicates and staleness continuously, instead of relying on a quarterly cleanup sprint that's out of date again within a month.
21. Exception queues with severity classification and owner routing (L2–3) Not every exception is equally urgent. Agents classify severity and route ownership automatically, so a critical failure doesn't sit in the same undifferentiated queue as a routine formatting issue.
22. Root-cause investigation via lineage (L2) When a downstream number looks wrong, an agent walks the lineage back through the transformations and sources that produced it — turning a root-cause investigation that used to take an afternoon of manual digging into a traceable, minutes-long lookup.
E. Governed action on pipeline output
23. Anomaly-to-task conversion (L3) A detected anomaly becomes a tracked task with an owner, a deadline, and an audit trail — not just another alert in a channel nobody's monitoring closely enough.
24. Rule-governed approval routing (L3) Before a proposed fix touches a production system, it routes through an approval policy matched to its risk level — automatic for routine, low-stakes changes, mandatory human sign-off for anything higher-stakes.
25. Standard, policy-bounded outreach triggered by a data event (L3) A defined data event — an overdue balance crossing a threshold, a shipment delay — triggers a pre-approved, policy-bounded communication automatically, with the boundaries of what the agent is and isn't allowed to say set explicitly in advance.
26. Dashboard-to-action conversion (L3–4) An insight surfaced on a dashboard becomes a tracked, assigned task instead of a slide nobody acts on — closing the most common and most expensive gap in enterprise analytics: the space between "we know" and "we did something about it."
27. Proactive work creation from a detected situation (L3–4) Rather than waiting for a human to notice a dashboard, an agent creates the work item the moment a situation is detected — shifting the operating model from reactive reporting to a standing execution loop.
F. Industry examples — real, anonymized pipeline-to-action deployments
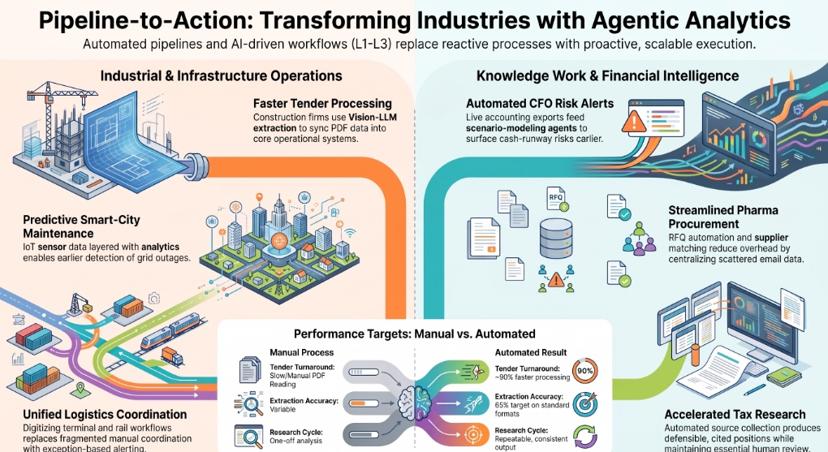
28. Smart-city infrastructure operator (L2–3) A large-scale smart-infrastructure operator runs monitoring and analytics across dozens of city-scale operations centres and millions of connected assets. Agentic analytics were layered on top of the existing smart-grid and IoT sensor data — predictive analytics for outages, losses, and field issues, with automated alert routing to resolution teams. The result was a shift from purely reactive monitoring to earlier detection and faster response coordination across grid operations at genuinely large scale.
29. Capital-markets research platform (L2–3) A market research and technical-analysis platform needed to turn continuous market data into repeatable research output rather than one-off manual analysis. Data ingestion feeding indicator pipelines, automated research workflows, and thematic dashboards replaced hours of manual chart-reading with a faster, more consistent production cycle for research and insight packs.
30. Pharmaceutical sourcing and procurement platform (L2–3) A pharma sourcing marketplace handling thousands of SKUs across a large excipient catalogue needed to automate the sourcing conversation itself — RFQ automation, supplier matching, and quality/regulatory document handling, layered with price, lead-time, and vendor-performance analytics. Procurement cycles shortened, vendor coordination overhead dropped, and pricing competitiveness improved through better visibility into the data that used to be scattered across email threads.
31. Commercial construction and remediation specialist (L2–3) A specialist remedial-building and diagnostics firm was drowning in complex tender documents that needed to move from PDF to structured operational data quickly and accurately. Vision-LLM extraction pulled structured data out of dense tender documents, synced it into the firm's core operational system with full audit logs, and flagged revisions and changes automatically. The result: tender document processing engineered for up to roughly 90% faster turnaround, with an extraction-accuracy target of around 95% on standard formats, and materially reduced bid risk through automatic revision detection.
32. Fintech CFO-as-a-service platform (L2–3) A platform providing continuous financial oversight for growing businesses needed a live connection between raw accounting and banking data and the forecasts advisors were building on top of it. A financial data connection layer pulling accounting and banking exports fed forecasting and scenario-modeling agents, with automated alerting for cash-runway risk. Analysis cycles got faster, cash-risk anomalies surfaced earlier, and the platform could offer advisory-grade insight at a scale that would previously have required proportional headcount growth.
33. Multi-entity private retail holding group (L2–3) A privately-held retail holding company with multiple operating entities needed governed, cross-functional intelligence spanning structured systems and unstructured documents, so leadership could move from insight to action without waiting on a BI team to build a new report every time. A unified context engine across structured and unstructured data, with a semantic governance layer enforcing consistent rules and formulas, converted dashboard insights directly into governed, auditable tasks. The operating model shifted from reactive reporting to proactive execution loops, with standardized decision logic and automated tracking of task completion across every entity.
34. Ports and terminal logistics operator (L2) A ports and inland-logistics operator needed better coordination between terminal operations and rail scheduling, historically tracked across disconnected systems and manual handoffs. Terminal workflow digitisation, yard and rail operational dashboards, and exception-based alerting replaced fragmented manual coordination. The result was more predictable terminal-to-rail throughput and materially more efficient coordination across the terminal-to-inland-logistics chain.
35. Tax research and compliance technology provider (L1–2) A specialist sales-and-use-tax research provider needed to speed up how quickly its research team could go from a client question to a defensible, cited position. Automated source collection and summarisation, combined with draft memo and position-paper generation, cut manual source-hunting time significantly and produced more consistent research output — with every draft still reviewed by a human before it goes to a client, matching the higher scrutiny tax positions require.
Three ways to buy AI-agent data pipeline automation
Not a head-to-head takedown of named competitors — a map of the three categories the market actually falls into, so you know which conversation you're having before you're three demos deep.
| Category | Good fit for | Where it stops |
|---|---|---|
| Open-source orchestration frameworks (workflow tools, multi-agent frameworks) | Prototyping, SaaS/API automation, internal experimentation, teams with strong in-house engineering | No native ETL, CDC, or schema-mapping depth — teams typically build the data layer themselves. See our detailed comparisons on n8n and CrewAI |
| AI-native ETL/ELT copilots | Teams standardized on one warehouse or lakehouse who want AI-assisted code generation for transformation logic | Strong at building pipelines; thin to nonexistent on governed action once the pipeline is running in production |
| Governed enterprise agent platforms (assistents.ai's category) | Teams that need the full loop closed — ingest, monitor, decide, act — with an audit trail a compliance or risk team will actually accept | Enterprise application connectivity (SAP, Salesforce, ServiceNow, and similar systems) is an integration project through published APIs, scoped and priced per deployment — not a one-click connector, and no proposal should imply otherwise |
If you're building or repairing pipelines, category two is where to look. If the harder problem is what happens after the pipeline runs — who decides, who's authorized, what's the record — category three is the conversation worth having.
The governed alternative to another point tool
Every platform on this list can show you a dashboard. Few can show you what happened after the dashboard — who acted on the anomaly, what rule authorized it, and what changed as a result.
That's the gap assistents.ai closes, and it's the one differentiator most of this market genuinely doesn't have an answer for: a control layer that sets autonomy levels per decision type, routes anything outside that envelope to a human, and keeps a full execution trace for every action an agent takes.
In practice, that looks like:
- Direct connectivity to PostgreSQL, Microsoft SQL Server, ClickHouse, DuckDB/MotherDuck, Amazon Athena, and Google BigQuery, plus Qlik Sense as an analytical source — with change-data-capture and event streams keeping operational state current between queries.
- A semantic layer so "overdue," "at risk," or "out of tolerance" means the same thing everywhere an agent or a dashboard references it — no more three teams arriving at three different numbers for the same metric.
- A deterministic rules engine with checksummed, versioned policy, so a decision made months ago can be reproduced against the exact logic that produced it at the time — not against whatever the rules happen to say today.
- Model-neutral reasoning across multiple model providers, so the reasoning layer isn't locked to one vendor's roadmap or pricing.
- An action layer that requires approval where you say it should, and executes without friction where you say it can, with every action logged end to end.
Real deployments already run this loop — from smart-infrastructure monitoring spanning millions of connected assets, to capital-markets research pipelines, to procurement and RFQ automation, to fintech forecasting and multi-entity retail intelligence — not as isolated pilots, but as governed, auditable operations doing real work every day. That's the difference between a tool that watches your data and a platform that's accountable for what happens next.
Schedule a demo to see the pipeline-to-action loop run against your own data, or explore the platform in more depth first.
See it against your own data
The fastest way to know whether a governed pipeline-to-action loop fits your operation is to run it against a real workflow, not a demo dataset. Schedule a demo or explore the platform to see how assistents.ai connects to your systems, applies your rules, and executes with the audit trail your risk team will actually sign off on.
FAQs
What is data pipeline automation?
Data pipeline automation is the use of software — increasingly AI agents — to reduce the manual effort of moving, validating, monitoring, and acting on data as it flows between systems, rather than relying on engineers to babysit each step by hand.
How do AI agents differ from traditional ETL automation?
Traditional ETL automation follows fixed rules: a schedule triggers a job, and if conditions change, a human updates the logic. AI agents reason about context — they can investigate why a job failed, decide whether it's safe to retry, or flag something a static rule was never written to catch, all without a human rewriting the underlying logic first.
Can AI agents fully replace data engineers?
No credible deployment does this today. Agents remove a large share of routine monitoring, triage, and reconciliation work, but engineers still own architecture decisions, novel failures, and anything a governed policy explicitly routes to a human.
What is a self-healing data pipeline?
A self-healing pipeline detects its own failures — a schema mismatch, a missing file, a broken upstream feed — and either fixes the issue automatically within a defined scope or escalates it with enough context that a human can resolve it in minutes instead of hours.
What is schema drift and how do AI agents detect it?
Schema drift happens when an upstream source changes shape — a renamed column, a new field, a changed data type — without warning. Agents detect it by comparing incoming structure against a known baseline and flagging deviations before they silently break downstream reports.
What's the difference between AI ETL and AI agents for data pipelines?
"AI ETL" usually means AI assisting with the build side — generating transformation code, mapping schemas, suggesting joins. "AI agents for data pipelines" is broader and includes what happens after the pipeline runs: monitoring, decisioning, and governed action on the output.
Is AI-driven pipeline automation safe to run unattended?
It depends entirely on the governance model, not the AI. A platform that lets you set autonomy levels per decision type — full autonomy for low-risk, routine actions, mandatory human approval for anything higher-stakes — is safe to run largely unattended. One with no such controls isn't, regardless of how capable the underlying model is.
How much do AI data pipeline automation tools cost?
Pricing varies widely by vendor and model — open-source frameworks are free to run but require engineering time to operate; enterprise platforms typically combine a platform fee with usage-based costs. Talk to sales for figures specific to your deployment.
Are AI data pipeline automation tools only for large enterprises?
No — smaller teams commonly start with lighter-weight or open-source tooling and adopt governed enterprise platforms as data volume, regulatory exposure, or the cost of a bad automated decision grows.